Know what
the boat did.
Donkey Analytics turns your instrument logs into polars, calibration corrections, sail crossovers and race debriefs. Built for IRC offshore racing, by people who do it.
Every race
leaves a record.
Most boats sail with a year of data on the instruments and never look at it. Donkey Analytics reads the logs you already have, checks the calibration, builds the polar the boat actually sails to, and puts it next to the race you've just done.
No spreadsheets, no exporting to three different programs. Load a track, pick a boat, and start asking questions.
Four jobs, in order.
Bring the logs
Upload a GPX, an Expedition CSV or an Adrena TRZ. Each import is named after the boat and the date, can be Kalman-smoothed on the way in, and arrives with a data-quality report: GPS spikes, gaps, stuck channels.
Trust the instruments
The Calibration workbench measures the eight calibration steps from those same logs, in the order the processor needs them, and hands you the corrections to type in.
Build the polar
Pull the ORC VPP polar, import an Expedition or Adrena file, or let the Polar Tuner build one from a season of tracks. Print the targets and laminate them.
Debrief the race
Legs from the course marks, manoeuvres ranked by what they cost, the start at the gun, and the fleet around you. One click for the PDF.
What's inside.
Library
- Boats
- One record per boat: its type, its polars, its calibration and every track it has sailed.
- Tracks
- Import instrument logs and passages, then trim, combine and tag them.
- Polars
- Keep the designer's polar, the one you built from logs, and the one you race to.
- Courses
- Race marks with start and finish lines, ready for leg-by-leg analysis.
Analyse
- Boat performance
- Speed and VMG against polar, manoeuvres, wind shifts and gusts, from one open track.
- Race
- Replay a race leg by leg and see where the time went.
- Fleet
- Compare your track against the boats around you.
- Trends
- Is the boat getting faster over the season? Now you can tell.
- Data lab
- Open the raw numbers when the charts aren't enough.
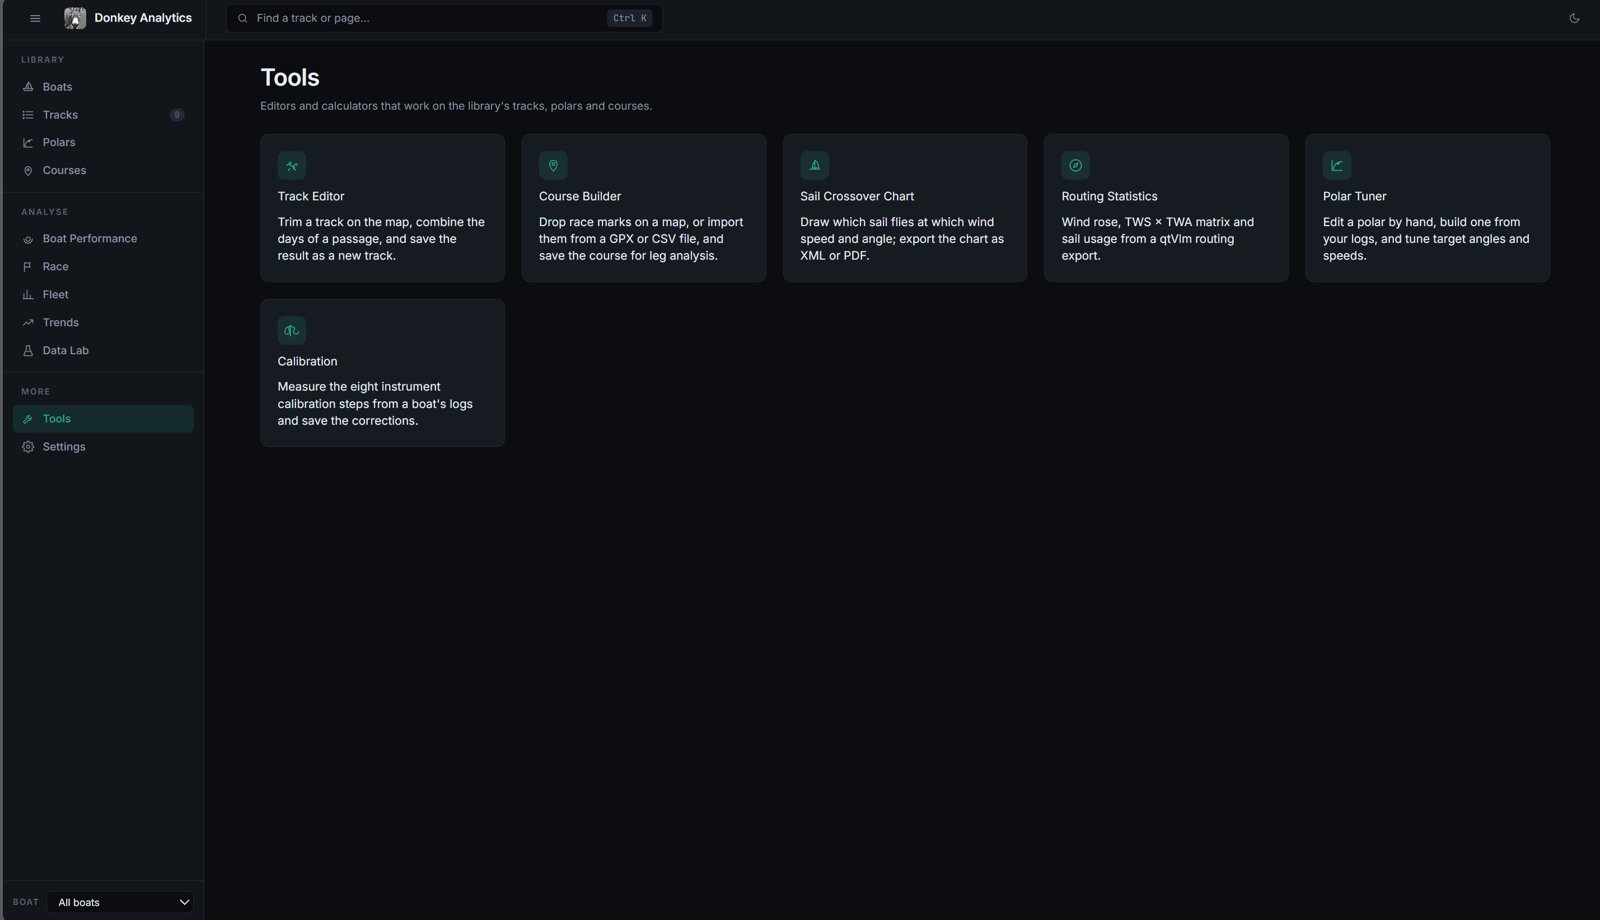
Tools
- Track editor
- Trim a track on the map, combine the days of a passage, and save the result as a new track.
- Course builder
- Drop race marks on a map, or import them from GPX or CSV. Mark the pin and the committee boat and the start line draws itself.
- Sail crossover chart
- Draw which sail flies at which wind speed and angle. Export as XML or PDF.
- Routing statistics
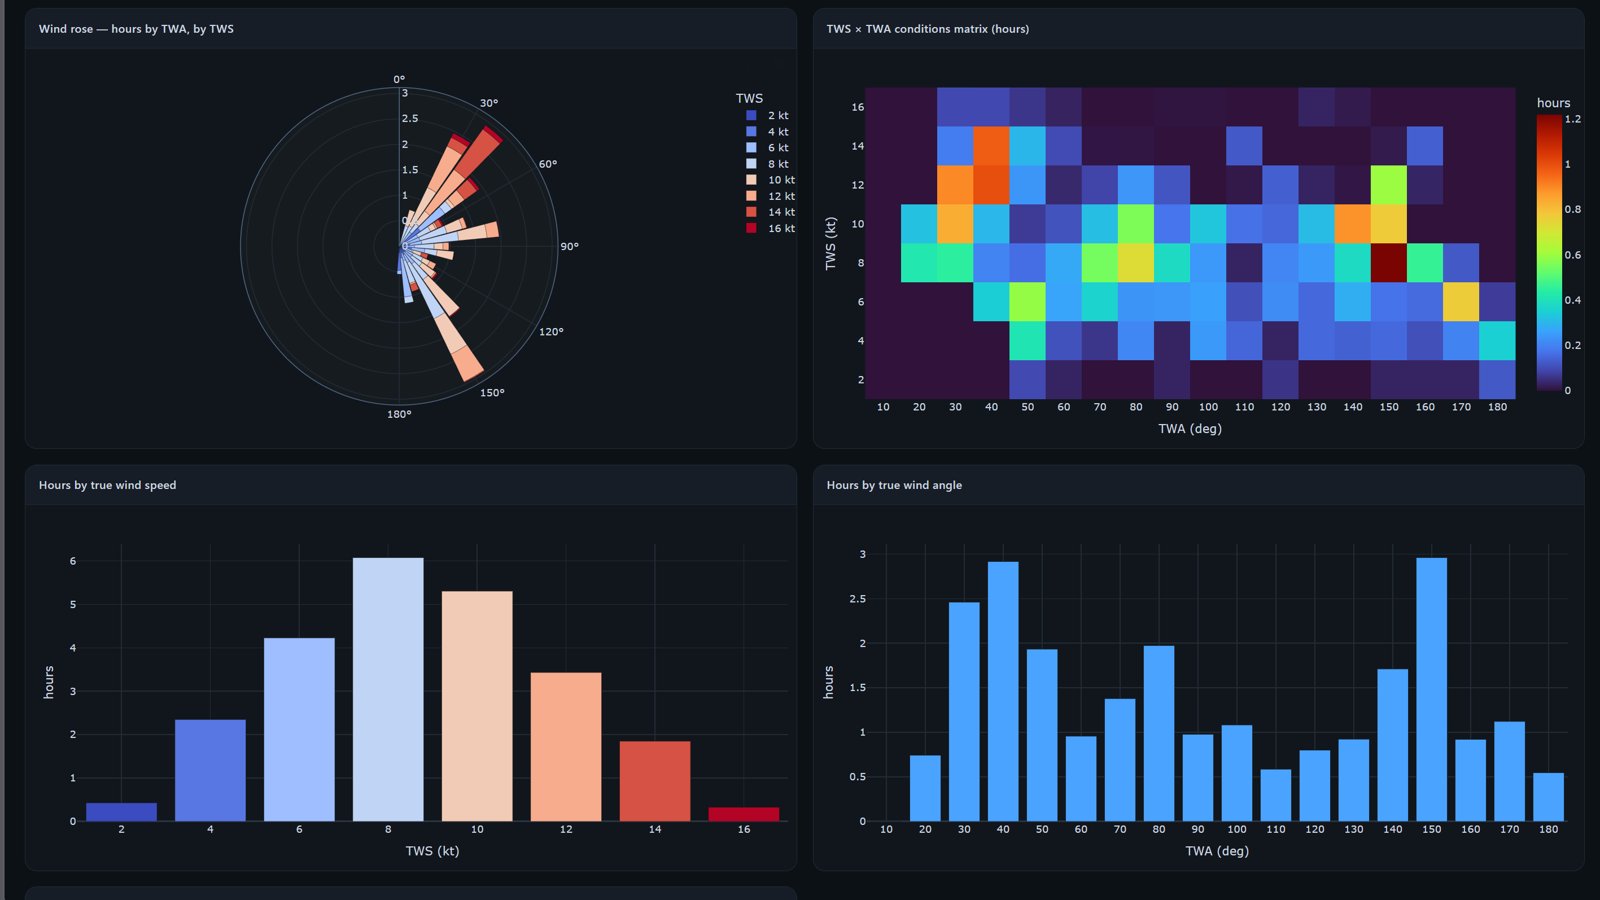
- Wind rose, TWS × TWA matrix and sail usage from a qtVlm routing export.
- Polar tuner
- Edit a polar by hand, build one from your logs, and tune target angles and speeds.
- Calibration
- Measure the eight instrument calibration steps from a boat's logs and save the corrections.
Every page answers a question.
Open a track and the views compute themselves. Pick a polar once and every number that can be scored against it, is.
Boat Performance
The map colours the track by wind speed, VMG, per cent of polar or the favoured tack, with tacks, gybes, wind barbs and tidal-current arrows drawn on top.
- Coverage heatmap. How much of the day was sailed in each wind speed and angle bin, by samples or by distance.
- On-polar performance. Per cent of target over time, its distribution, and a heatmap of where you over- and under-perform.
- Manoeuvres. Every tack and gybe ranked by distance lost, with the speed-build after each one.
- Wind shifts. Persistent shifts told apart from oscillations.
- Gust response. Boat-speed gain per knot of gust and how long it takes to arrive, upwind and down.
- Download debrief. All of it as one multi-page PDF, charts rendered natively so they stay crisp.
Race
Save a race once: the track, the course, the gun time, the fleet and the polar to score against. The legs come from the course marks themselves, found by closest approach and the turn round the mark, so there are no rounding radii to fiddle with.
- Per leg. Distance sailed against the rhumb line, efficiency, VMC to the next mark, cross-track error, per cent of polar, tacks, gybes and net wind shift.
- The start. Distance and time to the line at the gun, which side you were on, and whether you were over.
- Any segment. Box-select a stretch of track for its own distance, time, VMG and polar numbers.
- No course? Legs split by point of sail instead, so the page still works on a passage.
Fleet
Import the YB Tracker KML from the race and every boat's track arrives as its own entry, kept out of your library so a 78-boat fleet doesn't bury your own logs.
- Compare. Distance, speed, VMG and the upwind, reaching and downwind split, side by side, best in each column highlighted.
- Replay. Scrub through the race with every boat at its real position for any moment.
- Separation. Distance to the leader, moment by moment, so you can see exactly where the gaps opened.
- Legs and ranks. Places gained and lost at every mark of the course.
- Manoeuvres and lanes. Tack loss per boat, and whether the left, middle or right of the beat paid.
- Pressure map. Wind speed from every boat that logged it, laid over the course.
Trends
Season-long performance across every track of a boat, filtered by tag, date range and polar.
- Personal bests. Best VMG by wind band and the records behind them.
- Trend over time. Whether the numbers are moving the right way.
- Sail crossover from your own logs. Which sail actually went best in each wind band and angle, with thin data flagged rather than hidden.
Data Lab
Plot any logged channel of the open track against any other.
- Timeline, scatter, histogram and violin plots of whatever the instruments recorded.
- Interval tables. One, five and ten-minute summaries with tacks and gybes marked.
- Heel analysis when the channel is there, and a completeness report of which channels you have and where the gaps are.
Eight steps, in the right order.
Instrument calibration has an order because each step is measured on data that the steps before it have already corrected. The workbench reads a boat's logs, measures all eight at once, and shows every answer with its 95% interval, the number of independent observations behind it, and the checks it passed or failed.
A number the engine won't stand behind is never fed into a later step. That is how one bad channel quietly poisons a whole calibration, and it doesn't happen here.
- CompassHeading offset
- Heel & trimSensor zeros
- Boat speedSpeed-through-water factor
- Speed vs heelCorrection curve by heel angle
- LeewayThe leeway coefficient
- True wind speedCorrection table by wind speed
- Apparent wind angleMasthead offset
- True wind angleCorrection table by speed and angle
Three polars, one boat.
The designer's polar says what the boat should do, the one built from your logs says what it does, and the one you race to sits somewhere between. Donkey Analytics keeps all three next to each other.
Bring one in
Search the ORC VPP data by boat name or sail number and import the certificate polar directly, or load an Expedition or Adrena polar file.
Build one from logs
The Polar Tuner turns a season of tracks into a polar, scores it against held-out data so you know how far to trust it, and smooths it without flattening the peaks. Edit any cell by hand, with undo.
Take it to the boat
Target boat speed, VMG and angle tables per wind speed, printable as laminate-ready target cards. Export in Expedition format for the nav software.
Dark on deck, by design.
The app runs in the browser on any laptop or tablet, so it works at the nav station on a night watch as well as at the yacht club the morning after. There's a light theme for the yacht club.
Plays well with the rest of the nav station.
Logs in
- Expedition CSV
- Adrena TRZ
- GPX
- YB Tracker KML (fleets)
Polars in
- ORC VPP
- Expedition
- Adrena
Courses in
- GPX
- CSV
- Drawn on the map
Out
- Expedition polar
- PDF debrief
- Target cards
- Sail chart XML & PDF
- Processor calibration files
- qtVlm routing statistics
Under the hood
- Kalman smoothing
- Import-time quality checks
- Command line for batch jobs
- SQLite library
Free to start.
Nothing to install. Sign up, upload a track from your last race, and you're in.
14 days free, then one subscription
Every account starts with a 14-day free trial, no card needed. After that it's a single subscription, paid through Stripe and cancelled whenever you like from the billing page.
- A private library per account. Nothing is shared or pooled.
- Card details go to Stripe Checkout and never touch our server.
- Let it lapse and nothing is deleted. Your library reopens the day you come back.
Need it somewhere else?
Donkey Analytics can also run on a boat's own laptop with no login, or on a private server with an account for each of the crew. If that's you, get in touch.
Email usQuestions, answered.
What logs can I import?
GPX, Expedition CSV and Adrena TRZ, from the app or from the command line. Fleet tracks come in from a YB Tracker KML export. Missing channels are handled rather than fatal, and a big log reports its own progress as it loads.
Do I need a polar?
No. Every view that needs a target speed works without one and says so. With a polar you get per cent of target everywhere: on the map, per leg, per manoeuvre, per sail. Search the ORC VPP data for your boat, load a file, or build one from your logs with the Polar Tuner.
Will calibration work with my instruments?
The eight steps are the same chain whatever the processor, so the workbench is manufacturer-neutral. The result is a set of numbers and tables to enter, printed in the order you'll enter them, plus the raw files for processors that take them.
It's in beta. The engine checks itself against a simulated log with known errors on every run, but treat its output as a second opinion until you've seen it agree with your own boat.
Does it work at the nav station?
It's a web app, so anywhere with a browser and a connection: the nav station on a phone hotspot, a tablet in the cockpit, or the yacht club the morning after. Dark theme by default so it doesn't wreck your night vision.
Is my data private?
In the hosted app every account owns a completely separate library: its own database, uploads and outputs. Nothing is shared between accounts and nothing is pooled. Payment goes through Stripe Checkout, so card details never reach us.
Is it live, on the water?
No. Donkey Analytics is for afterwards, working from the logs the instruments already wrote. Live telemetry is on the wish list, not in the app.
Which boats is it for?
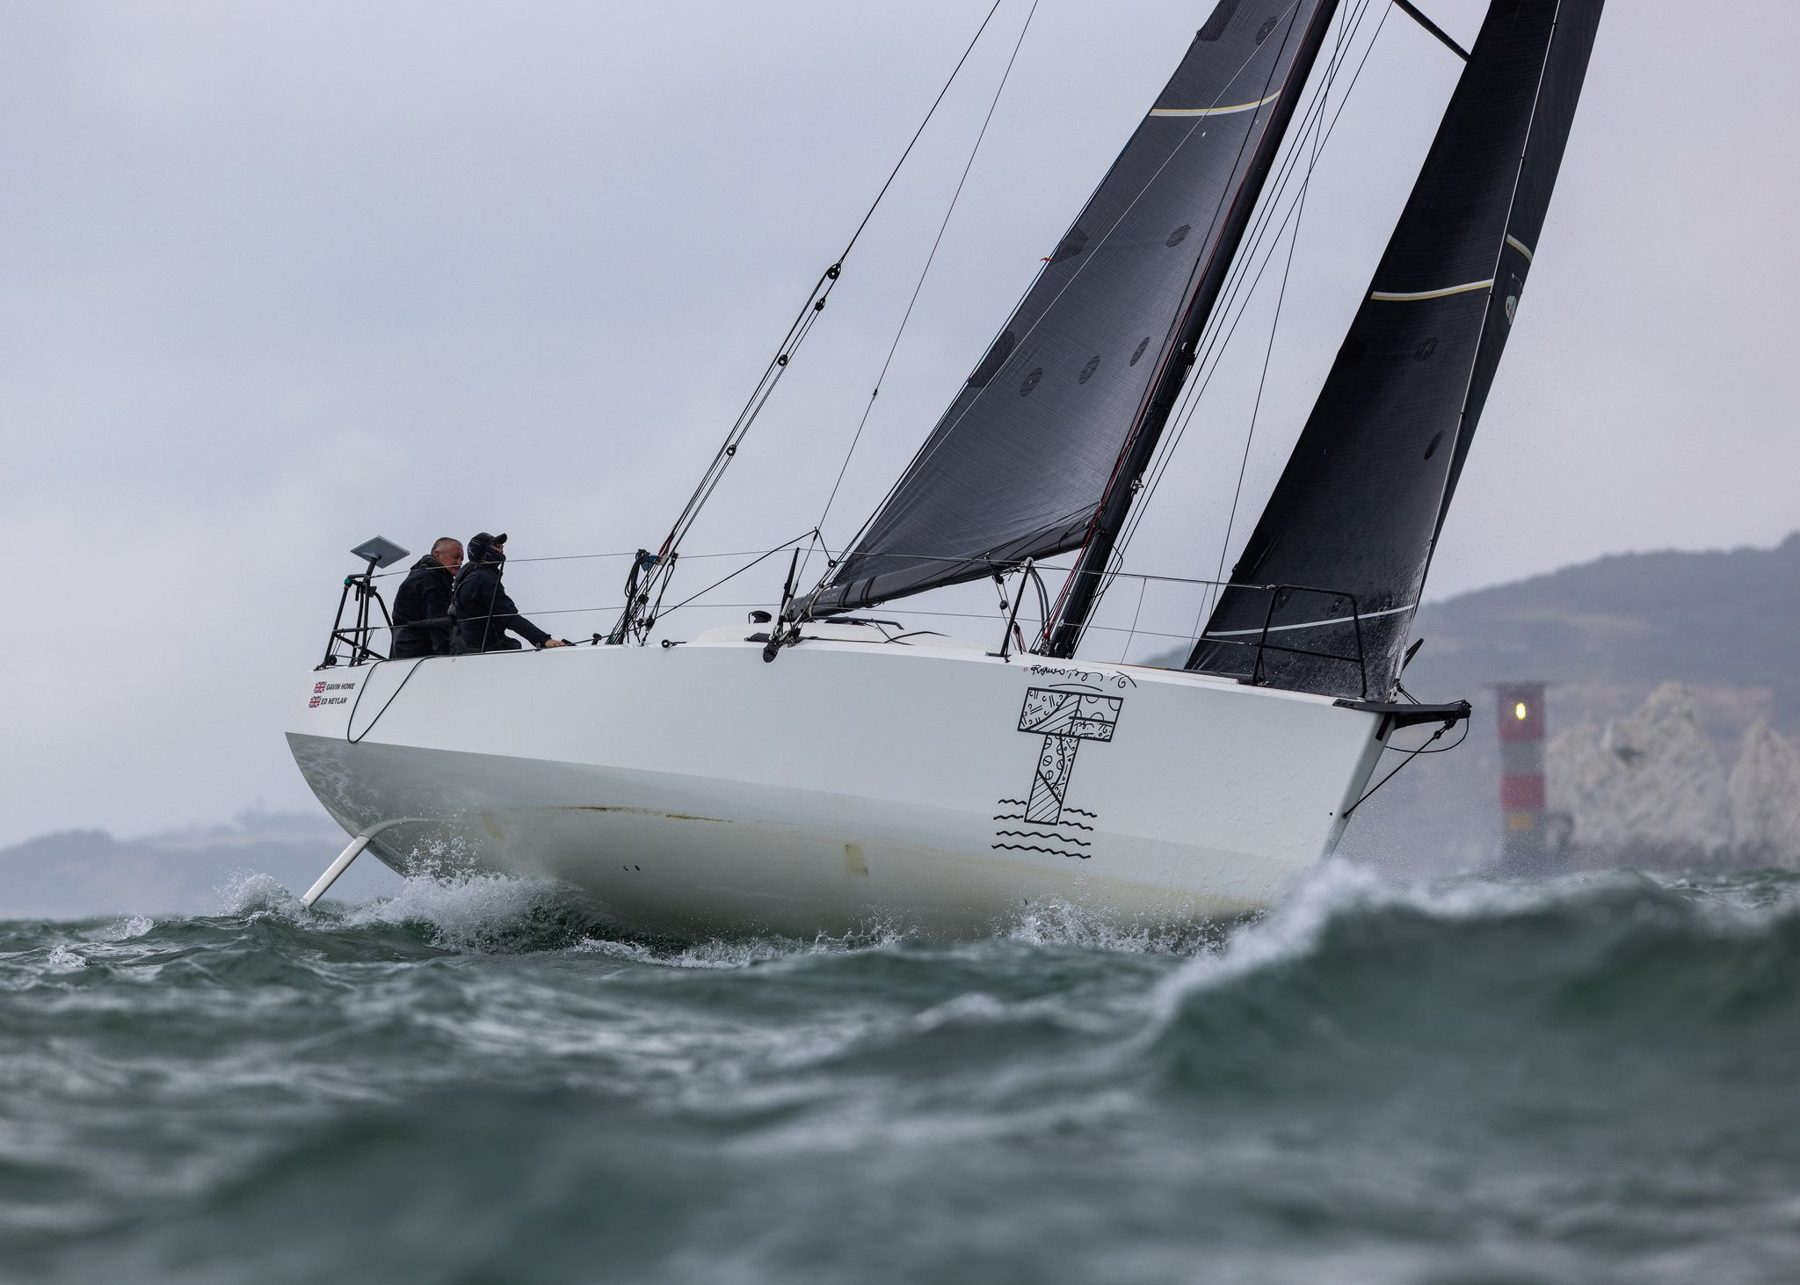
Anything with instruments that log. It was built for IRC offshore racing on the Solent and the RORC calendar, double-handed and fully crewed, but a polar is a polar.
Built on the Solent, for the RORC calendar.
Donkey Analytics started as a set of scripts written between races to answer the questions the crew kept asking: were we on polar, was the wind instrument lying, which sail should we have had up. It's grown into a full toolkit, still shaped by what actually helps on the water.
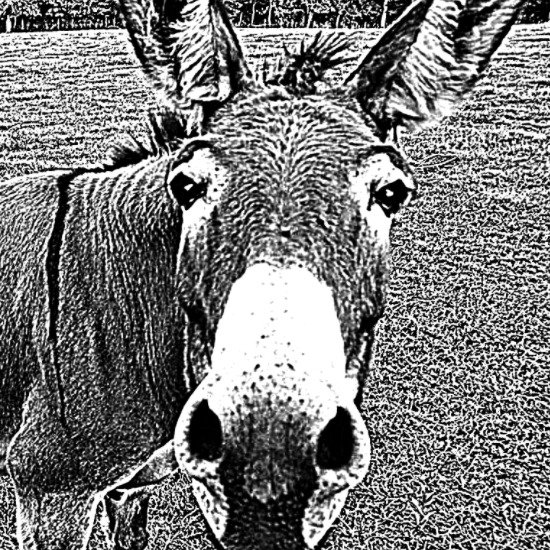
Why a donkey? Because it carries the load, doesn't complain, and looks you straight in the eye.
Bring your logs.
Sign up, load a track from your last race, and see where the time went. Free for 14 days.